Thoughts for Life Insurance Actuaries
This COVID-19 post is for those advising life insurers. It covers mostly financial considerations. In this fast moving environment, this post provides more questions than answers, to help actuaries think through as many angles as possible.
The COVID-19 pandemic outbreak has reached community transmission stage in most countries, including Australia – containment or suppression are now the only realistic outcomes, with virus eradication now considered impossible without an effective vaccine (which many experts consider is likely 18 months or more away).
Media coverage of all the health, mortality and social/economic impacts has reached saturation point and it is impossible to keep up with every new piece of information.
Like the virus itself, this will change and grow exponentially – we would welcome feedback and suggestions that could be included in future posts to continue to assist the profession.
Life Insurer Financial Management and COVID-19
The implications of COVID-19 for every aspect of life are overwhelming (start the morning on instant coffee? self hair-cuts? how to home school while on a management meeting remote video conference?) an initial list of financial management matters are set out below:
At a high level, for life insurers, the key roles/tasks actuaries have in this pandemic outbreak include providing information to answer the following questions:
- Claims cost increases – taking into account both direct impacts (i.e. insured becomes infected with COVID-19) and indirect (i.e. potential impacts on disability claims from; economic downturn, stress, medical system challenges, internal company challenges, etc):
-
- What is the likely claims costs increase (from both direct and in-direct impacts) – when do these increases occur and over what time frame?
- What does the range of potential outcomes, including adverse outcomes look like?
- Non-claims costs impacts – question per claims but for; lapses, investment returns, new business, expenses, etc.
- Existing policy management – where we have re-pricing rights or right to change terms enforce an exclusion etc, are the actions being taken appropriate?
- New business management – are the actions being taken on pricing, terms and conditions sufficient to manage anti-selection risk?
- Investment strategy, capital (including raisings) and liquidity management – understanding both the processes for tracking capital position, liquidity position, investment market impacts, and claims impacts as real time as possible, and looking at the ICAAP to think through trigger points for action on capital and liquidity.
- Scenario testing – what scenarios should we be running now to understand potential impacts 6/12/18 months down the track?
- APRA expectations and action – what is the regulator going to expect and what actions are they going to take? How do we ensure we are geared up to answer questions?
- Actions from other stakeholders
- Other regulators (ASIC, AFCA, ATO, etc)
- Customers
- Staff
- Reinsurance – what implications does the pandemic have for your reinsurance strategy and what approach to the above matters is your reinsurer taking? What about other reinsurers you would consider using? What is the financial position of your reinsurer under the scenarios you are modelling? If you are a reinsurer, how are you discussing these issues with your clients.
- Competitors – what approaches are your competitors taking?
- Processes and information sources for updating of all the above – what information collection (both internal to the organisation and external) have we established to best inform decisions?
This blog post looks at two major areas:
- Data sources and some initial population and industry modelling on mortality and morbidity rates and claim rates (including some consideration of indirect impacts from the economic situation)
- Indirect impacts from the wider economic crisis for companies to consider and factor into scenarios.
Best and Most Relevant Sources of Data
At this early stage, data is often incomplete and / or inconsistent. In particular, the level of testing varies enormously across countries and there are very few estimates of the actual levels of community infections.
There are many data sources available. These are ones that appear current and authoritative
COVID-19 case and death statistics and/or data
This is a list of the main sources of country based infection and death data we have been using.
- WHO Dashboard
- Johns Hopkins Interactive Map
- Worldometers.info
- Worldometers.info – Australia
- Covid19 data
- Our World in Data
- Tableau
Infection rates
Infection rates are quite a critical assumption
South Korea Corona Virus Cases by Age
- South Korea is the poster child for testing so this is highly relevant and prevalent information.
- Good to compare the age structure to the AUSTRALIAN data at Covid19data.com.au, above.
- Highlights the point that COVID-19 is not an old persons’ disease and mortality will materially shift across the board.
COVID-19 outcome data – death and recovery rates
Another critical assumption for actuaries, so here we have described the type of data available.
- All data displayed available in link to the underlying datasheet
- Chinese (11 Feb) and Italian (14 March) mortality rates by 10-year age bands.
- Chinese (11 Feb) and Italian (17 March) co-morbidity mortality rates.
- The datasheet provides links to the underlying studies
- PDF file of the modelling “Impact of non-pharmaceutical interventions (NPIs) to reduce COVID-19 mortality and healthcare demand” performed to examine which strategies might best reduce hospital case loads.
- Numbers for UK and USA.
Population morbidity data
AIHW – Australian burden of disease database
Aggregated output of burden of disease metrics from the Australian Burden of Disease Study. for around 200 diseases and injuries. It also includes estimates of attributable burden for around 30 risk factors.
SARS-CoV-2 virus surface longevity
Aerosol and Surface Stability of SARS-CoV-2 as Compared with SARS-CoV-1. New England Journal of Medicine
Adjustments to Obtain Australian Specific Assumptions/Modelling
To obtain assumptions for modelling mortality impacts requires a number of inputs and assumptions. These would include but are not limited to: mortality rates by age/gender for people who have COVID-19, infection rates by age/gender and adjustments to translate the impact on the insured population.
In simplistic terms the additional mortality an insured person would be:
[Infection Fatality Rate] x [Population Infection Rate] x [Insured Population Adjustment]
Infection Fatality Rates
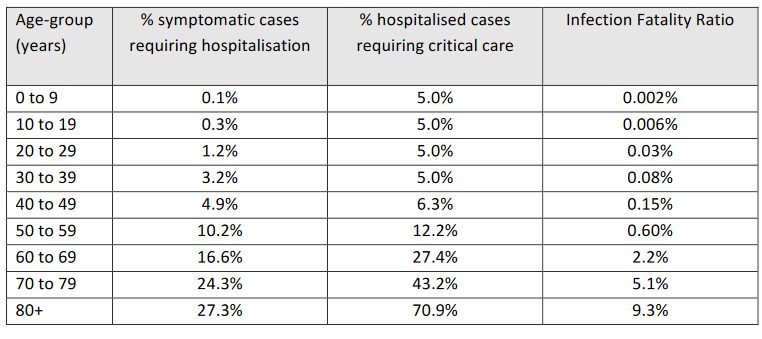
A number of papers have already published estimates of mortality/fatality rates in various forms for people with COVID-19 (e.g. Imperial College paper). These range from being crude ratios of number of deaths divided by number of cases to more sophisticated attempts that provide age-based rates and account for reporting delays and other inaccuracies. When using mortality rates you should be careful to use ones that have been properly adjusted for delays in reporting and also account for any undiagnosed/reported cases. In all the examples we have used in this paper we have used mortality rates from the Imperial College report are shown below. They are based on a synthesis of a number of different sources, and are a good general starting point.
Infection Rates
Without any interventions we could expect that overall population infection rates well in excess of 50% (81% predicted in the Imperial College paper). The early experience from a few countries (e.g. China, South Korea) shows that the overall infection rate can be successfully suppressed with the right interventions.
How the pandemic will ultimately play out in Australia will critically depend on the interventions that are put in place. The initial stages of Australia’s response indicate that the federal government has the intent and resolve to put in place measures that will act to mitigate or suppress the overall infection rate to levels that will avoid many of the more adverse scenarios.
The possible range for the infection rate will be very large. The Imperial College paper adopts a range assuming intervention of 1% at the very low end (assuming the strictest measures are put in place) up to 20% (assuming that some measures are still put in place).
We consider the Imperial College paper a valuable source of information, nonetheless, given the potential unknown impact of various factors (including in relation to compliance with counter measures, the potential for second waves of infection after counter measures have been in place, etc) at this stage, even with some intervention, it is not highly certain that infection rates in Australia will be limited to within the 20% “high” range quoted.
In this context we note that some other sources have adopted higher infection rates for developed countries/countries expected to have similar rates to Australia.
Insured Population adjustment
Any modelling used for insured lives needs to allow for differences between the general population and the insured population. This would include demographics (e.g. age, gender and socioeconomics), infection rate and infection fatality rate. Something that is known about the infection fatality rate for COVID-19 is that it is much higher for people with existing comorbidities especially hypertension, cardiovascular diseases and diabetes. A reasonable range on the difference is that insured population mortality could be anywhere from 10% to up to 80% of the general population fatality rate. The adjustment will likely be quite different between retail and group business due to the underwriting of retail business. You would expect that retail will be towards the lower end of the above range and that group business will be towards the higher range.
Example population level analysis
Some example population level analysis is provided below based on these age-based mortality rates.
Different infection rates/multiplier scenarios have been included of the proportion of the population infected of 1%, 5%, 10%, 20% and 40% (100% is really just illustrative rather than being a realistic potential outcome).
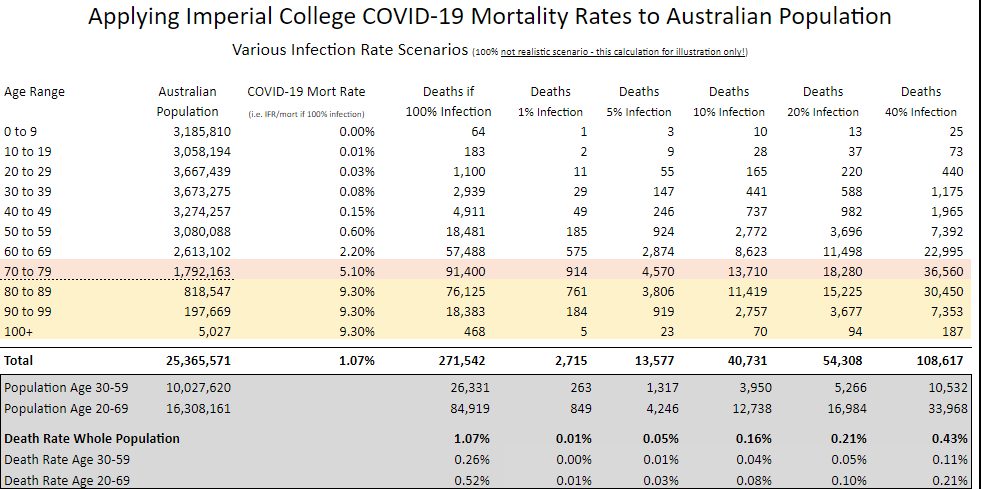
The table includes death rates for the 30-59 age range which might be a typical range capturing the majority of insureds in some retail portfolios. The table also includes death rates for the 20-69 age range as an indicative age range that might apply for some group schemes.
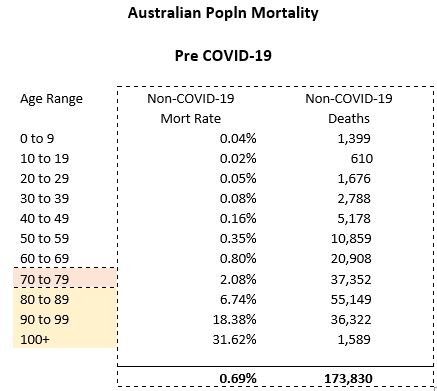
For comparison, we have calculated the normal population mortality for Australia below.
Even before adjustments for differing levels of mortality and infection (e.g. due to co-morbidity/other health, gender, potential different infection rates by age, etc) there will be other differences within individual groups that can be very significant given the rapid increase in mortality for each individual year of age.
For example while a group scheme may cover up to age 69, the population distribution within the age decile groupings in the Australian population may be very different. This is because the membership profile and sums insured for a group scheme between 60 and 69 will usually be affected by retirements (similarly for retail the proportion at the older end of the 50-59 age group may be lower than for the Australian population overall).
This factor may mean the actual death rates indicated below may be somewhat high for a typical portfolio but actuaries need to consider their particular portfolio.
Notwithstanding all the potential limitations and acknowledging that appropriate assumptions will be different, some potentially interesting observations on this analysis include:
- The minimum event stress in LPS 115 requires a death rate of 0.5 per 1,000 lives per annum for 2 years (total of 1 per 1,000 over 2 years).The 40% infection rate/multiplier results in deaths higher than this APRA minimum (for both the “30-59” age group at 1.1 per thousand and the “20-69” age group at 2.1 per thousand). So does the 20% scenario with the “20-69” age group.
- Actuaries might find it useful to determine an overall Australian death rate (i.e. the total across all ages) implied by their assumptions so that they can compare/calibrate it with other analyses being published. This can assist with indications on whether your assumptions are more conservative / aggressive than those other analyses (i.e. certain analyses being published only have mortality estimates at a total population level). For example one data source noted potential US deaths of 2.2m – resulting in a population mortality rate of 0.67% (based on US population of 327.1m). This can be compared with the total population mortality rate in the table above of 0.43% (using the 40% infection rate/multiplier).
- Given the already wide range of estimates being observed for mortality, this comparison does not seem unreasonable as this particular US study may have been a more pessimistic view (and may also incorporate other differences – infection rates, health levels, etc). Further adjustment might be considered for age profile depending on which country you are comparing to. The US population has similar proportions by the age groups that the Imperial College COVID-19 mortality rates are provided by. However, the population in the UK is a bit older on average i.e. using the Imperial College mortality rates (and not allowing for any gender differences), and assuming uniform infection rates across age, the death rates across the overall total UK population would be nearly 20% higher than for Australia/US.
- Other interesting comparisons of potential COVID-19 deaths with non-COVID-19 deaths/death rates (using ALT 2013-15 without mortality improvement):
- At the 100% infection rates the deaths of those age 80+ from COVID-19 are about the same as the non-COVID-19 deaths (about 95,000). This is also true for ages 20-49 (about 9,000-10,000).
- At the 100% infection rates the COVID-19 deaths at ages 50-79 are more than double the non-COVID-19 deaths
- Total population deaths from COVID-19 under a 40% infection rate are about 1/3rd of the non-COVID-19 deaths.
We have not undertaken modelling of direct impacts on IP or TPD. The LPS 115 minimum event stress does require an assumed level of insureds being temporarily disabled for 30 days and 60 days (although there is no minimum required level of TPD). We may consider this further in later posts but for now, one public source indicated timeframes based on severity of symptoms/outcome as follows:
- Death – symptom onset to death ranged from 2 to 8 weeks
- Severe and critical cases – recovery between 3-6 weeks
- Mild – recovery about 2 weeks
If the longer-term outcomes are consistent with this it may be the case that disablement durations are no longer than those in the LPS 115 minimum event stress.
We have also calculated the additional mortality to an insured lives portfolio allowing for potential better mortality for an underwritten portfolio.
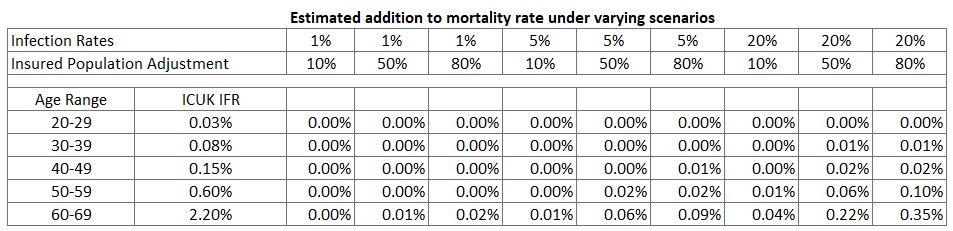
As can be seen above:
- the worst-case estimate remains below the prescribed APRA pandemic event of 1 per 1,000 over two years
- there is a very wide range of estimates depending upon assumptions about infection rate and how this COVID-19 translates to the insured population
Indirect Impacts
Actuaries should not overlook the potential for indirect impacts to be even greater than direct impacts.
Economic Impacts
Economic impacts are beyond the scope of this post. The key point here is for companies to think about potential scenarios for their own investment portfolios. A good starting point is this work from Warwick McKibbin.
Impacts on claims assessment and management
The impacts on claims assessment and case management are likely to be numerous and wide-ranging. The following is just a sample – some of which are already emerging.
This will need to be watched closely as it is likely to change significantly with; regulations, changes/issues in the medical system, other counter measures, technology, regulatory responses including claims arbitration bodies decisions….etc etc.
Potential negative impacts:
- Case loads – impact from increased claims levels from direct sources which challenges claims manager resource volume/capability. Impact company’s ability to continue to its claims management model, policies/procedures. These strains may be further increased if:
-
- Case managers themselves get sick, caring for sick, or are less effective working at home. How is the technology?
- Case manager absenteeism, concerns about infection.
- Face-to-face meetings with claimant (and other co-ordination of parties in case management processes) – impacts from not being able to conduct meetings in person with claimant. Even things like process for booking and co-ordinating different parties (claimant, rehabilitation specialist, treating Doctor, case conference manager, insurer/other parties).
- Difficulty in Maintaining Medical Treatment – following examples highlight how medical treatment might be impacted:
- Availability of treating Doctor.
- Availability of specialists (pyschiatrists, cardiologist, oncologist, back, etc).
- Availability of other medical / para-medical consultations (occ therapists, pyschologists, etc). Some of these are conducted telephone-basis so this may continue effectively – nonetheless noted that some may require or more effective if in person.
- Difficulty in Implementing Recovery Plan and Claimant Well Being – in addition to medical treatment, recovery plans often include other steps, activities and milestones in a claimant’s recovery – restoring a person’s overall well being. Examples include:
- Exercise/sport, relaxation, travel, sleep and diet.
- Social activities.
- Safe partial work/suitable duties work.
Counter measures may make these more difficult to organise/plan or for the claimant to undertake (e.g. gatherings cancelled, gym not recommended, isolation recommended, etc). There may be alternatives but they may become more expensive or time-consuming to organise and harder to track.
These points are besides the potential overall more difficult starting point and lower overall pre-claim well-being a person may be in because of the societal/economic impacts of COVID-19.
- Rehabilitation and retraining – (as for recovery plan implementation) counter measures may make using claimant rehabilitation and/or retraining strategies (whether voluntary or enforcing them where mandatory) more difficult.
- Monitoring progress consistent with recovery plan – it is key for case managers to understand a claimant’s adherence to an agreed recovery plan – and take action where problems arise, including intervention where the claims risk has changed and alternative approaches/treatments are required. For many of the reasons mentioned above, the COVID-19 outbreak may increase difficulties in identifying which claims are/are not progressing in line with agreed recovery plan.
- Treating Doctor medical evidence, IMEs, other reports – Given the pressure on the healthcare system to come, medical evidence for claim is not going to be at the top of a doctor’s priority list. This will lead to pressure to admit claims without evidence.
- Fraud – the ability to detect fraud will be more difficult.
Impacts on product management/repricing/reinsurance
New Business
The general insurance industry has a well established process for pausing underwriting new business during a disaster. It is not an established practice in life insurance however. Actuaries advising their companies will have to consider whether this is appropriate:
For retail business – should you be taking on new risk at the moment?
If you do, is there a Covid19 exclusion clause? and/or extra premium for Covid19 cover? This would be very standard in an equivalent general insurance context, but might not meet community expectations?
Repricing
All companies should be considering their repricing strategies and gearing up for each part of their portfolio. In particular thinking through and understanding how quickly they can reprice.
- When and how much repricing should be happening?
- Is the answer different for group and retail?
- How should companies be planning for repricing and when should they reprice?
Request for feedback
This group is working on a more comprehensive note for Life insurance actuaries. We would welcome feedback on what you would like to see us address in that note.
Here are a few questions to get you started.
-
- What are actuaries most concerned about? What would they like information on that they think the actuaries institute or other companies can share?
- Do you strongly agree/disagree with points in blog and why? Have we missed something?
- What are you working on that you would like to share? What have you seen that other actuaries or other life insurance industry participants/stakeholders doing that all actuaries should be aware of?
- How should we go about sharing information?
- What modelling are you doing?
Disclaimer: This article does not necessarily reflect the views of the authors’ past, present or future employers.
CPD: Actuaries Institute Members can claim two CPD points for every hour of reading articles on Actuaries Digital.